On-boarding and Deploying Your First Devices on the Helium Network - Part 1
Accessing and Using the Data from a LoRaWAN Device
Create a TagoIO account.
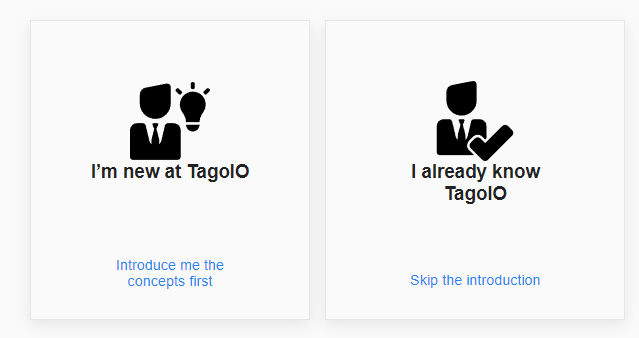
Suggest taking the Introduction to concepts tour.
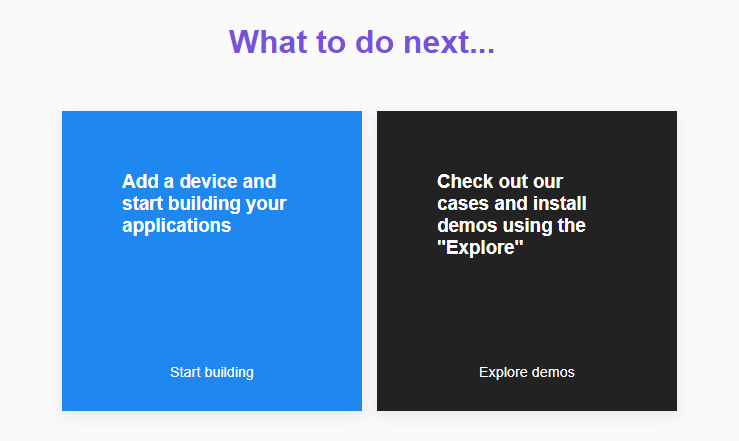
Next, select Add a device and start building your applications.
TagoIO has extension training on all the features of their platform, which can be accessed from the Quickstart menu. In addition, we recommend that you review the TagoIO video tutorial on integrating with Helium. Note that the initial steps for adding a device to the Helium Network shown in the video have already been completed in the prior steps of this document.
To securely connect the Helium Console account to the corresponding TagoIO account with an integration, a unique authorization must be generated on Tago.IO. This authorization must be created before any devices can be added to the Tago.IO account. Create a new authorization by clicking Authorization in the upper right-hand corner of the Tago.IO home page.
Note
You must be on the Devices tab to see the Authorization button.

Enter a name for the authorization, for example Helium, and click Generate.
![]()
This process creates a unique API token (unrelated to HNT tokens) that will be used to secure the encrypted data communication between the owner’s account on Helium Console and their corresponding account on Tago.IO.
Next, click Copy to copy the token to your clipboard so you can paste it into the new integration that you will create on Helium Console during the next step.

In a new browser tab, log in to your account on Helium Console (console.helium.com). You will need to be logged in and have access to both accounts simultaneously.
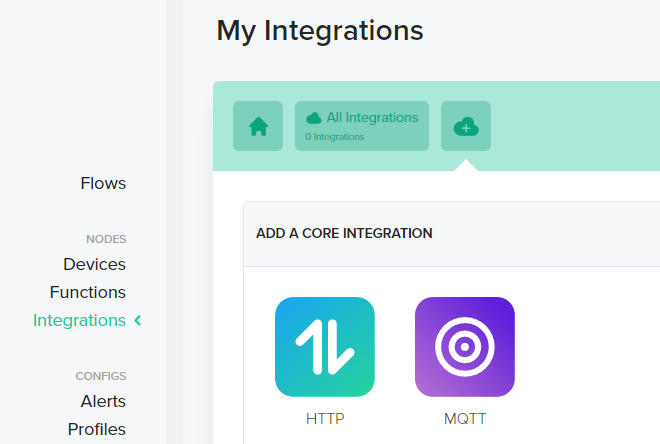
From the Helium Console account, navigate to Integrations in the menu on the left and click the “+” icon.
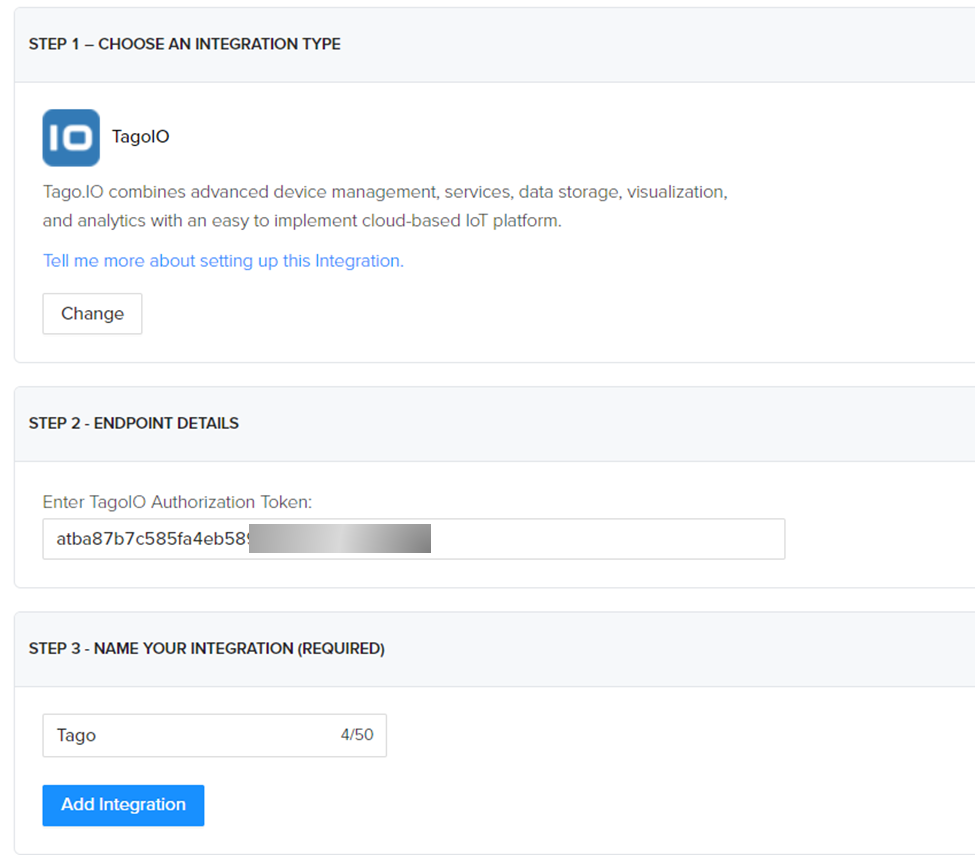
Click the Tago.IO icon.

Click the +Integration icon.
Paste in the authentication token value generated at Tago.IO, which you copied to your clipboard earlier, and enter a name for this integration. Finally, click Add Integration.
The next step is to add a Flow that is configured to route all messages (and data) from the mailbox sensor to the Tago.IO integration that you just created. From the menu on the left, select Flows and drag down the icon for the mailbox sensor.
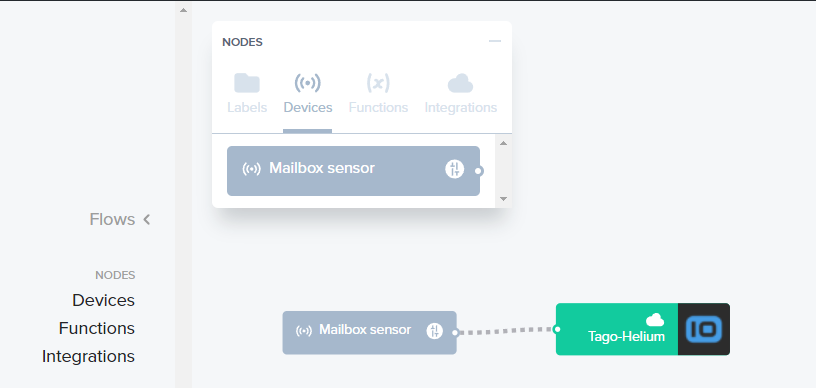
Next, from the NODES menu bar, select Integrations, locate the integration you just created, and drag its icon into the workspace.
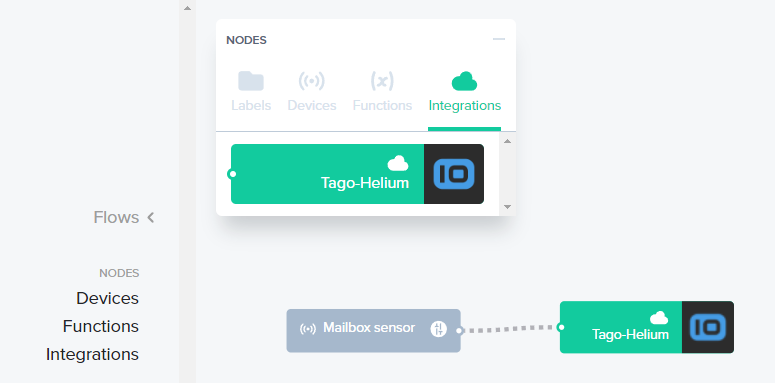
Click on the white connection dot on the mailbox sensor and drag a connection to the Tago-Helium integration. This instructs the Helium Console server to route the messages from the mailbox sensor to the account at Tago.IO.
At this point, Helium Console is set up to securely send any messages (and payload data) from the mailbox sensor to the corresponding account at Tago.IO. Our final step is to go back to the Tago.IO account and add a connector and dashboard for the mailbox sensor.
From Tago.IO, select the LoRaWAN Helium network option from the menu on the right and then search for the specific LoRaWAN sensor by its manufacturer and/or model number. Remember that we are using a Dragino LDS02 device for our mailbox sensor. Enter Dragino LDS02 in the search field and select its icon.
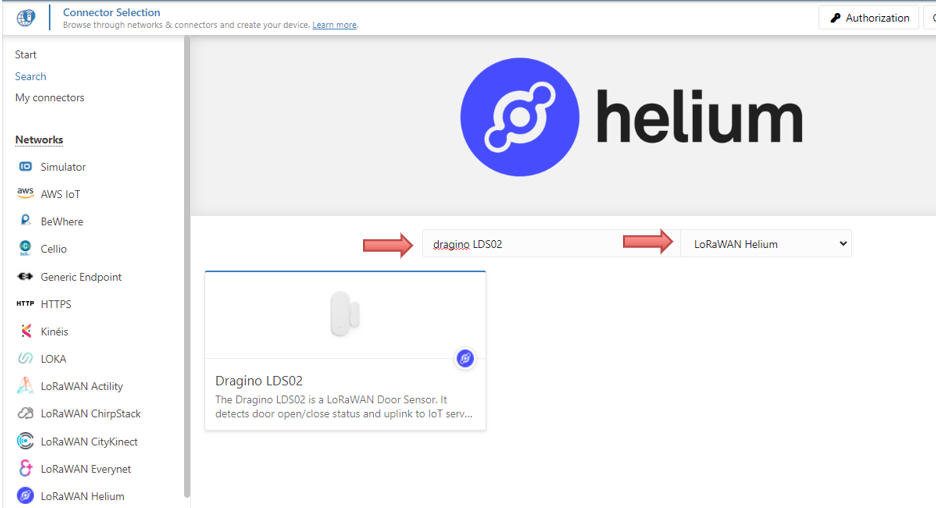
Example of TagoIO add device menu
Next, enter a name for the device and its unique DevEUI when prompted. Again, each LoRaWAN device or sensor has a unique and specific DevEUI.
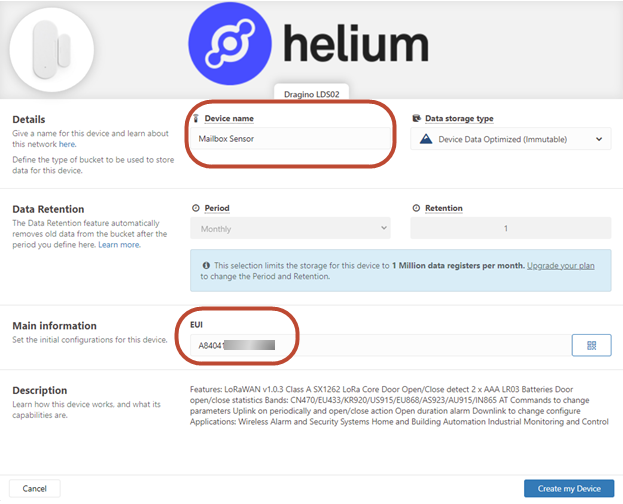
Example Create my Device
Finally, click Create my Device.
If successful, an All Done icon should appear. Remember that the authorization was previously created; one authorization can be shared by multiple sensors. Click Continue and verify that the connection is working. From the Tago.IO main page, click Devices in the upper left corner.
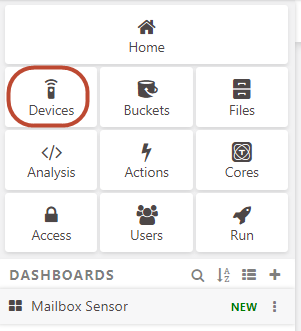
TagoIO Menu
The list of devices and their settings is displayed.
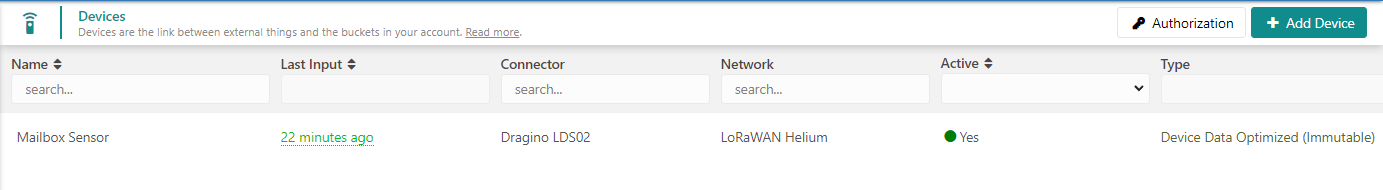
Click the device name from the list of devices to open a detailed dashboard.
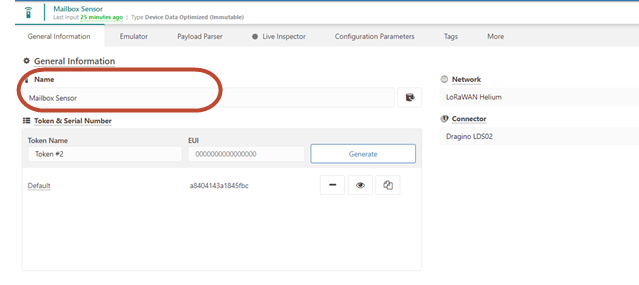
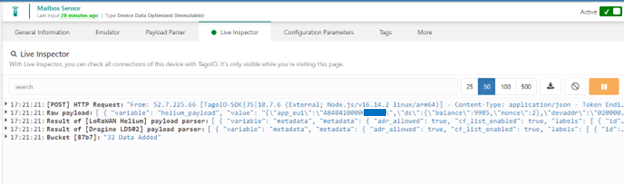
To view live data coming from the sensor, select the Live Inspector tab and then click the green Play icon. This will display all messages coming from the device.

Now, manually trigger the device to send a message to the Helium network. In the case of the Mailbox sensor, simply move the magnet away from the sensor. The hidden green LED on the top cover of the sensor should flash, indicating that it sent a message. If everything is working, you should see the raw data from the sensor transmission in the Live Inspector window. If you do not see data, please verify that you validated your TagoIO account. In some cases you may need to log out and then back in to TagoIO.
Every message sent by a LoRaWAN device contains metadata and message payload data, which is typically parsed into datasets, including discrete variable names. The Tago.IO platform performs this data parsing and manages all of the available data being sent by devices. For example if a device sends a single message that contains both temperature and humidity readings, this data would be organized into a temperature variable and humidity variable that can be referenced independently.
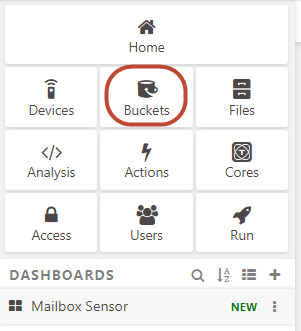
To view all of the available data variables for a device in TagoIO, first click the Buckets icon. From the list that displays, click the name of the device you want to inspect.
From the device menu, select the Variables tab.

This view breaks out all of the specific data included in the message received from the device, in this case the Mailbox sensor. This includes the metadata parameters from the LoRaWAN transmission as well as the payload data or status information from the device or sensor. In the case of the mailbox sensor, the main variables of interest for this example are:
|
Variable |
Description |
|
door_open_status |
Value equal to 0 when the door is closed and 1 when the door is open |
|
last_door_open_duration |
Measurement (in seconds) of how long the door was left in the open position. This is useful in setting alarms. |
It is important to remember these variable names; we will use them to create our mailbox dashboard in the next step.
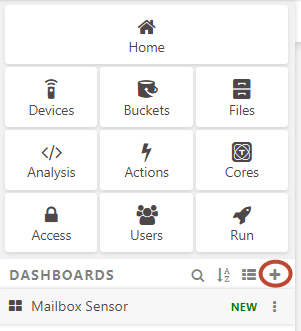
Now, to view the status of our mailbox sensor, let’s create a simple dashboard. From the Tago.IO menu, select the + sign next to DASHBOARDS.
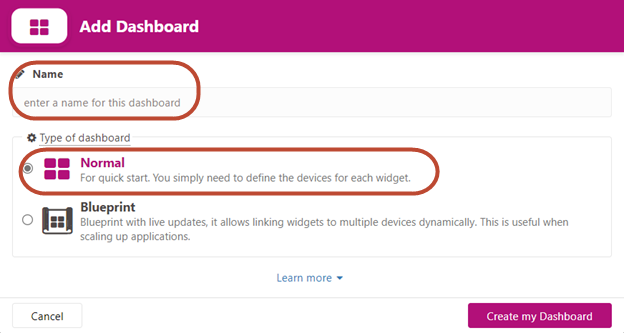
This will create a dashboard workspace and allow you to create customized widgets. Enter a name for your dashboard and select Normal as the dashboard type, then click Create my Dashboard.
Next, add a widget to the dashboard by clicking the + Add Widget icon.

Option to add widget to new dashboard screen
To get started, create a dynamic table from the Add Widget menu to view the sensor data contained in the messages sent by the mailbox sensor. Click the Dynamic Table icon.
Select the Dynamic Table Widget option from menu
Enter the information required to configure the table: for example, provide a title. See the Tago.IO documentation for details on all customization options.
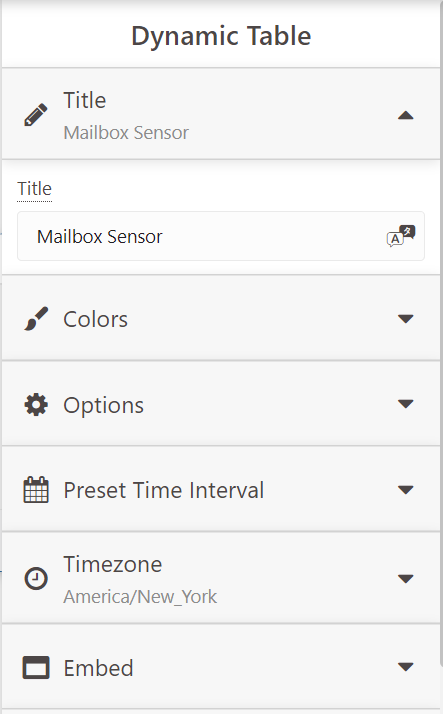
Customization options for the table.
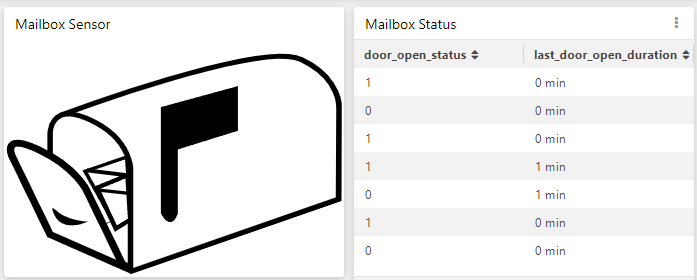
Next, configure the columns in the table for each of the desired data variables contained in the messages sent by your device: in this case door_open_status and last_door_open_duration. In the newly created Dynamic Table, select Column #1. Next, assign data from a device by selecting the Device field and assigning the Mailbox Sensor, then entering door_open_status in the Variable field. Add a column and repeat these steps for the last_door_open_duration variable.
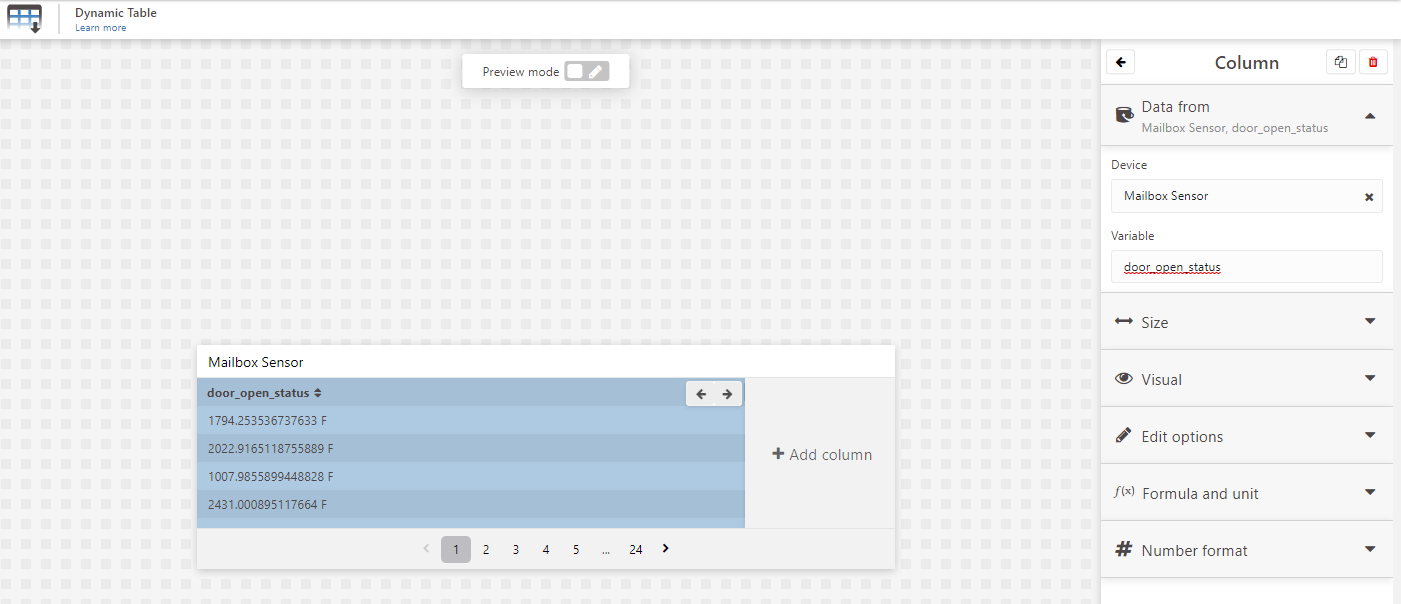
Click create to save settings and then return to the Mailbox dashboard.
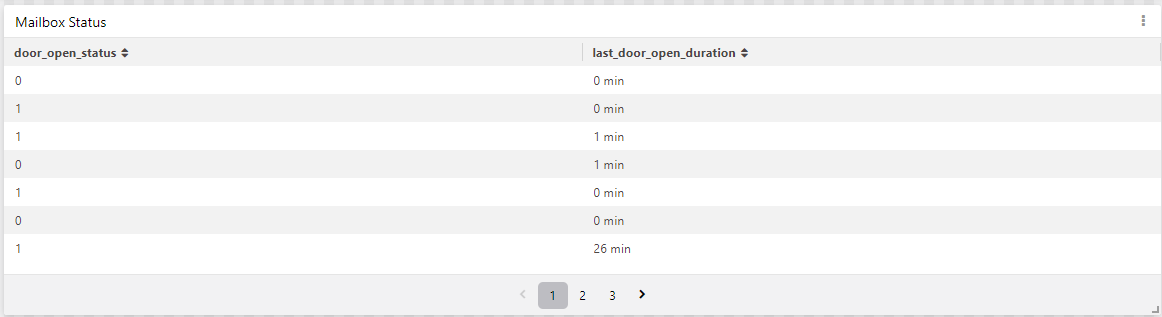
Data from the mailbox sensor should now be visible in the dashboard. Manually trigger the mailbox sensor and watch the table update. (It may take a few seconds for the table to update.)
Now, we will add a graphic icon to symbolize the status of the mailbox door. We used the following SVG graphic symbols, however, any SVG graphics or image files will work.
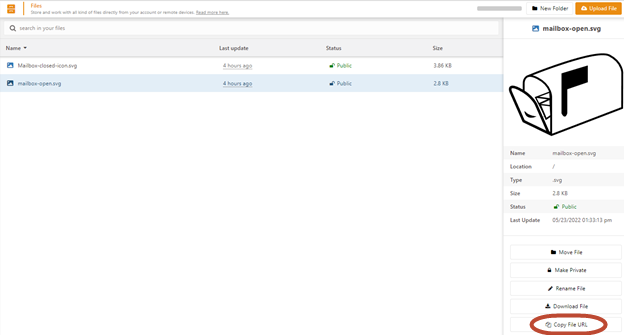
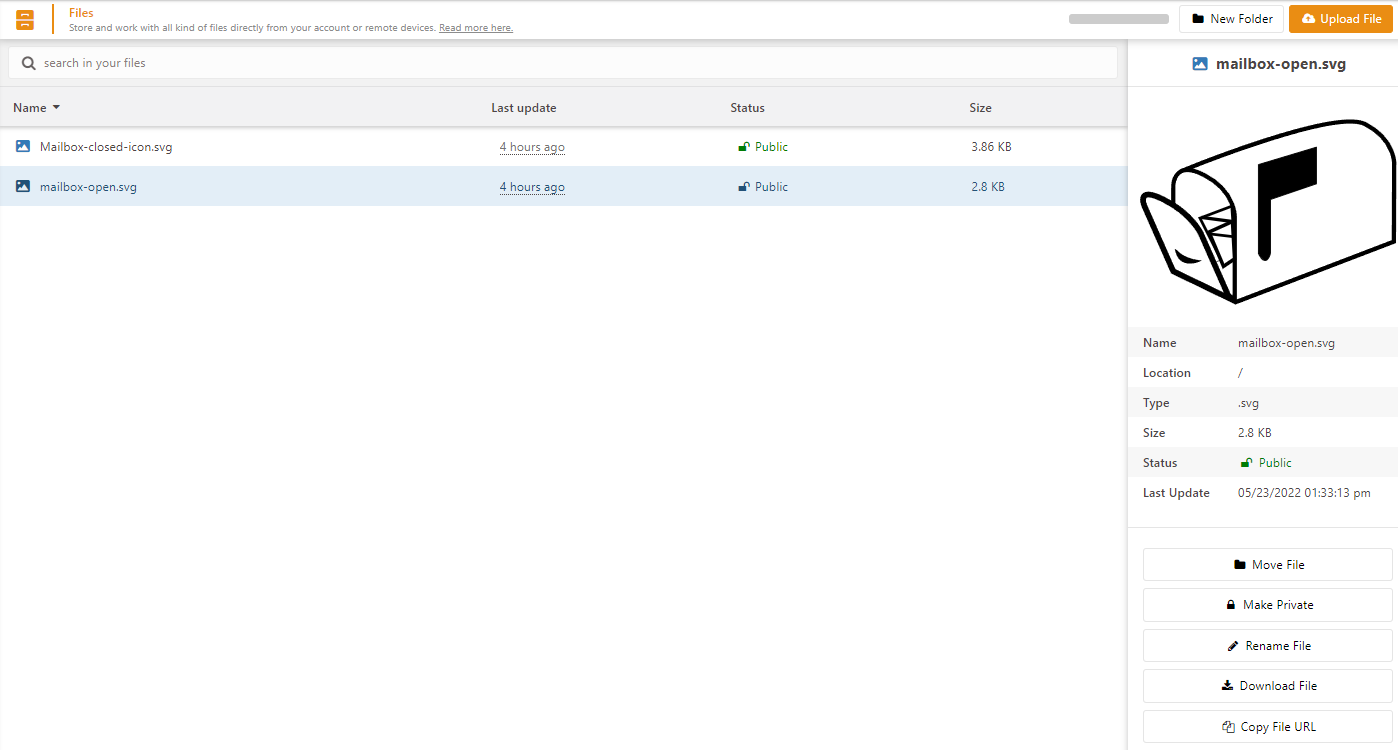
Click the Files icon and upload the image files of your choice to Tago.IO. Make sure that the URL links are correct, and the images are marked as 'public'.

Add custom graphics by clicking the Files icon
Once the images are uploaded, copy the URL (network path) to each of these images to use in the next step.
Go back to the Mailbox dashboard. Click the pencil icon to enter Edit mode. Next add another Widget.
Select to add additional Widgets to a Dashboard
Now select the Image widget from the Widget menu and add it to the dashboard.
Next, customize the widget with the mailbox sensor data and SVG graphics.
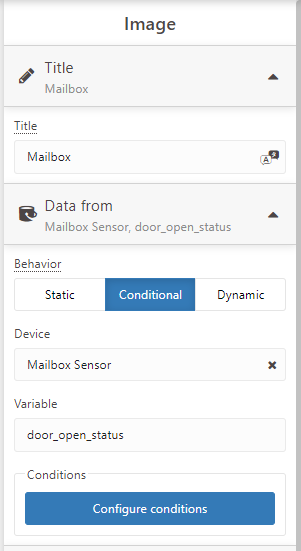
Enter a title for the widget and set the Behavior to Conditional. From the Device list, select Mailbox Sensor and enter door_open_status as the Variable.
Next, click Configure conditions. This will allow us to display different graphics for representing the state of our mailbox door.
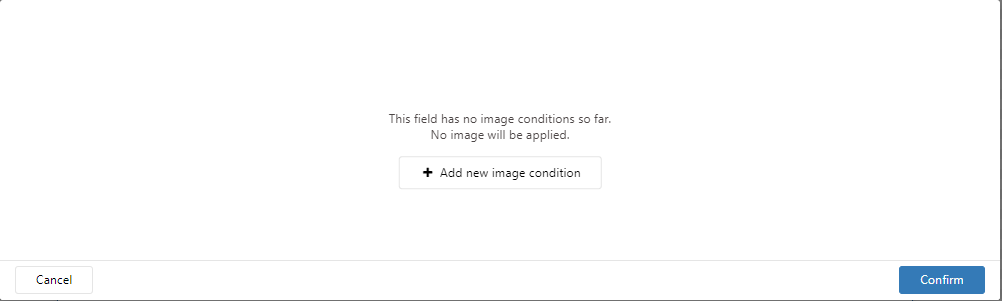
On the next screen, click Add new image condition and enter the information for a closed door state. The mailbox sensor’s door_open_status equals “0” when the door is closed. Paste the URL link for the “closed mailbox” SVG graphic from the previous step. Do not click the Confirm button yet!
Instead, click the “+” icon within the same screen to add another condition, in this case for the open mailbox door state.
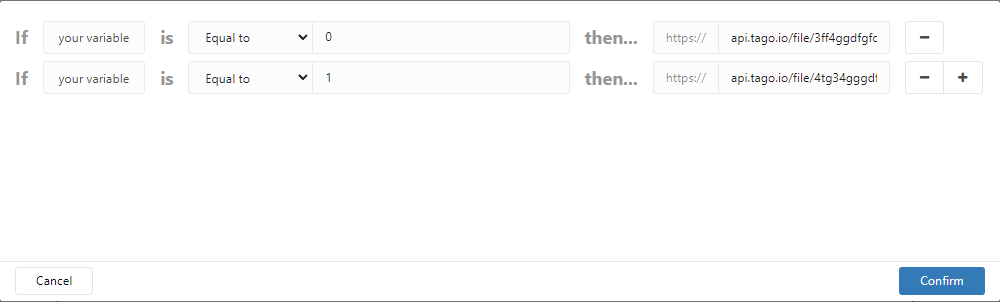
The mailbox sensor’s door_open_status variable equals “1” when the door is open. Paste the URL link to the “open mailbox” SVG graphic uploaded in the previous step. Now click Confirm and view the updated Mailbox dashboard. Under Options, set the Resize properties to Contain Image to ensure the image is properly scaled.
Test the dashboard by manually triggering the mailbox sensor. Live updates to both the table and mailbox graphic display.

To share the IoT dashboard via a public webpage, navigate to the Mailbox Sensor dashboard configuration settings by clicking the three dots on the left side menu.
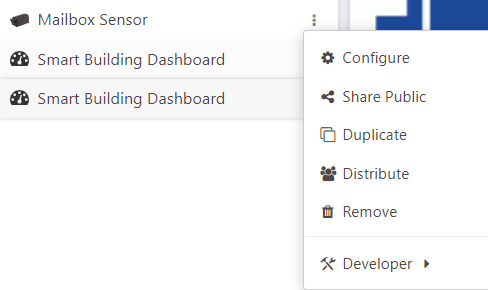
Next click the Share Public tab. This allows the generation of a public webpage showing the status of the mailbox sensor.
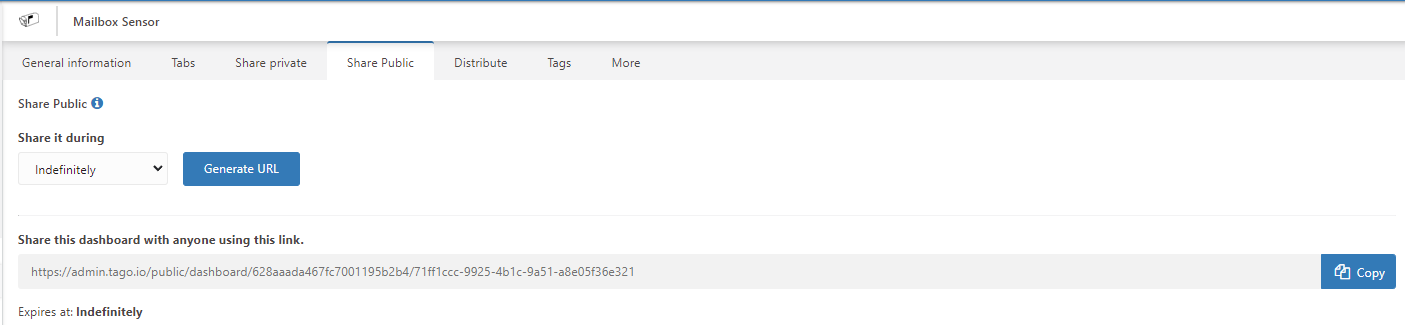
(Click to see live status of the sensor)
There are many additional features within the TagoIO platform that you can use to fully customize and productize IoT solution deployment. These include adding algorithms, logic, and text/email alerts. Dashboards and templates for dashboards can be easily created and then shared or duplicated. Refer to the TagoIO documentation and tutorials for more information.