On-boarding and Deploying Your First Devices on the Helium Network - Part 1
Adding your first LoRaWAN device
For this example, we will be adding a Dragino LDS02 door sensor and will deploy it on the door of a mailbox.
Before actually adding the device, you should create a default configuration profile that allows you to set some global parameters for all devices assigned to it. Creating profiles lets you make changes that apply to groups of devices instead of having to update them individually. If all of your devices are being deployed in the same scenario and region, then they can likely share the same profile.
Once logged into your account, click the Profiles menu item in the menu on the left and then click the “+” button.
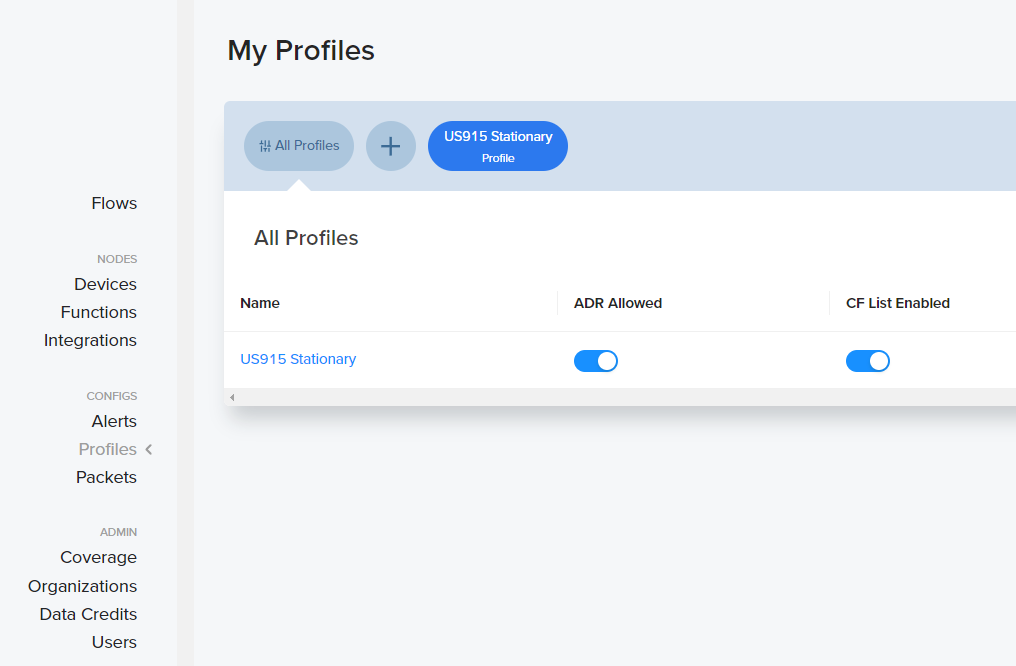
Creating a profile in Helium Console
For this example, we will be deploying a sensor in the United States and will set up a “US915 Stationary” profile. We will enable Adaptive Data Rate (ADR), since our mailbox sensor is stationary, and we must enable the Join-Accept CF List, since we are in the US915 channel plan. Join-Accept CF selection allows the network to tell the device which radio channels to communicate on.
It is also necessary to adjust the RX (receive window) timing to 2 seconds. The RX timing defines the delay that the Helium network server uses between receiving an uplink message and sending the downlink ack (acknowledgement) message. The default value (typically 1 second) for the RX window is defined in the LoRaWAN 1.0.x Regional Parameters specification, but can be adjusted to meet the needs of specific deployments.
A higher number increases the receive delay window and generally can increase downlink reliability as higher latencies between the LoRaWAN gateway and network server will be tolerated.
However, devices that suffer from drift may not work as well and a longer delay reduces the theoretical maximum rate of communication since a subsequent transmit may only be accomplished after both receive windows.
If your sensors have a high percentage of dropped downlink messages or don’t transmit reliably, relaxing the RX delay to 2 - 4 seconds may improve performance.
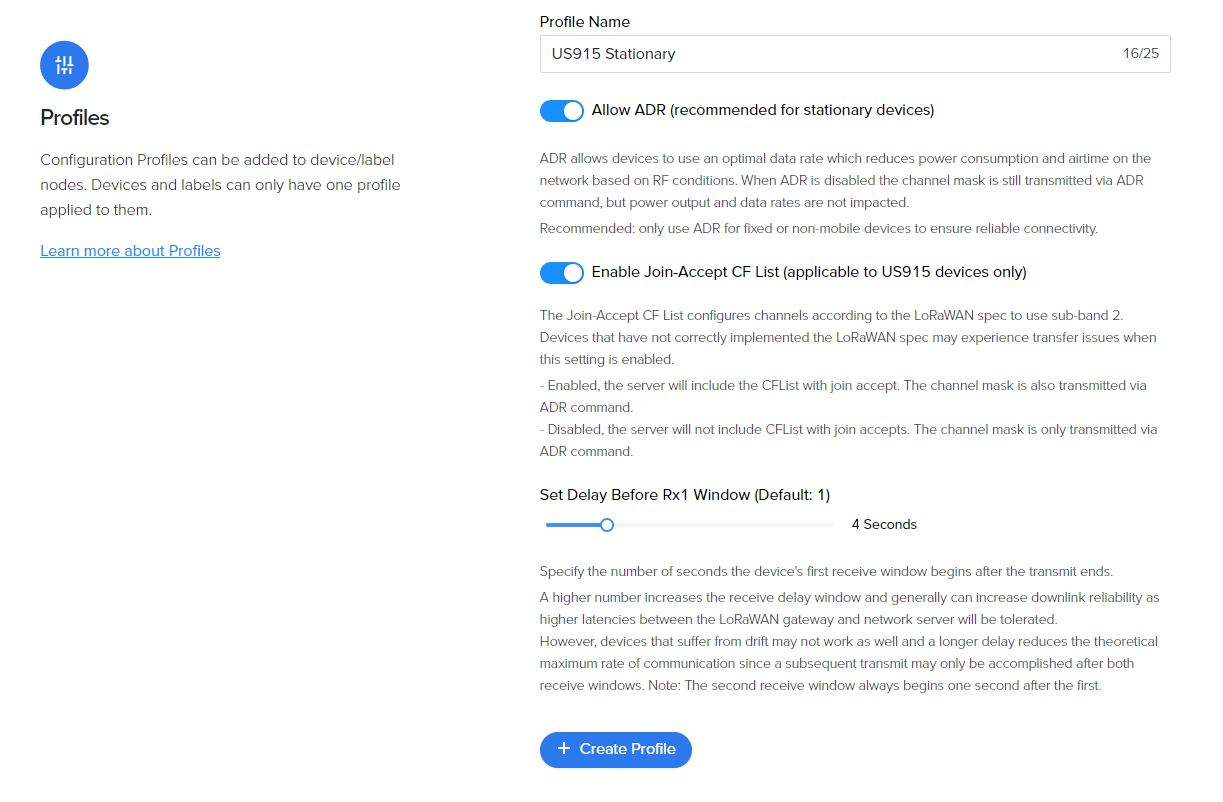
Example settings for a device Profile
For more detailed information on these LoRaWAN configuration selections, see the following documents:
-
Understanding ADR
-
Understanding Class A End Devices and RX windows
-
LoRa best practices device management joining and rejoining
To add a LoRaWAN device, click the “+” icon in the lower right corner of the screen and select Add Device.
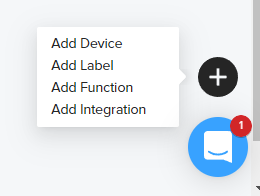
Add Device option
The Add New Device window opens, allowing you to enter the required information.
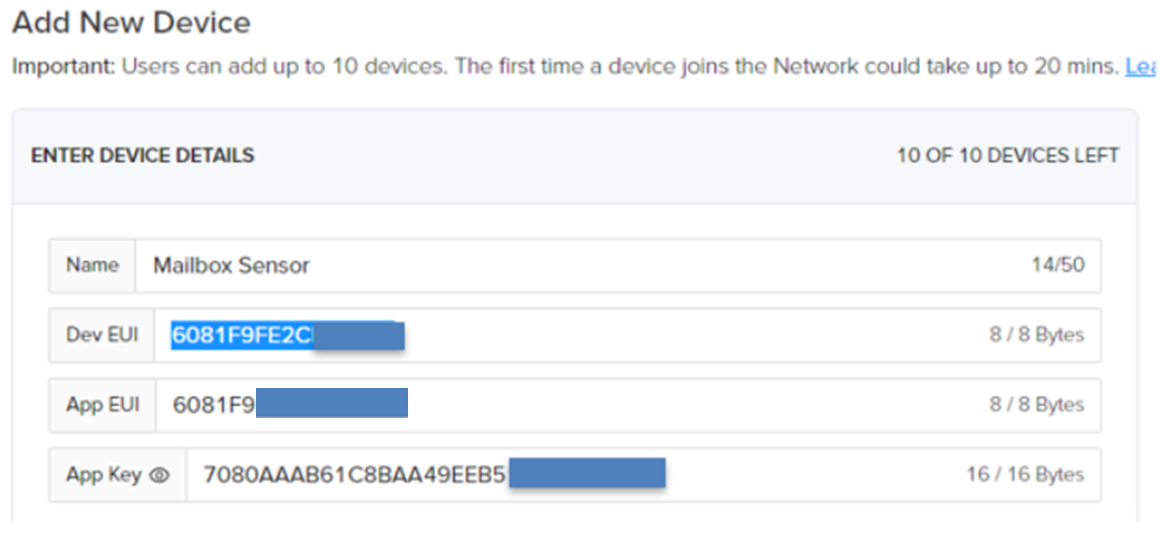
Default EUIs and Key need to be updated with the parameters for the specific sensor being added.
Give your device a descriptive name, such as Mailbox Sensor in this example. Helium Console will automatically generate a default DevEUI, JoinEUI (AppEUI), and AppKey. If you are building your own DIY LoRaWAN sensor, you can use these parameters and program them into your device. If you purchased a commercial LoRaWAN sensor, you need to override these default parameters with the specific values provided with the purchased sensor.
Enter the correct DevEUI, JoinEUI (AppEUI), and AppKey for your device. Take extreme care to ensure all values are correct; even one typo will prevent the device from joining the network. Also, select the proper group profile (created in the previous step) for your device. Click Save Device.
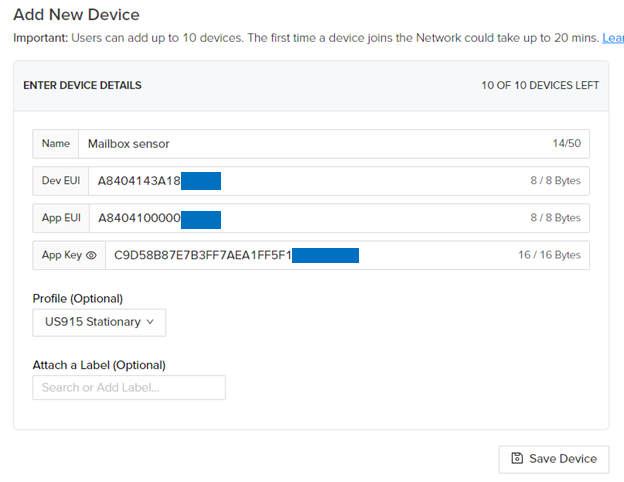
Sensor-specific parameters entered, overriding default values
After successfully adding a device to your account, click Devices in the menu on the left to view all of your devices. Notice that the status of your device will show as pending until it successfully joins the Helium Network and transmits messages.
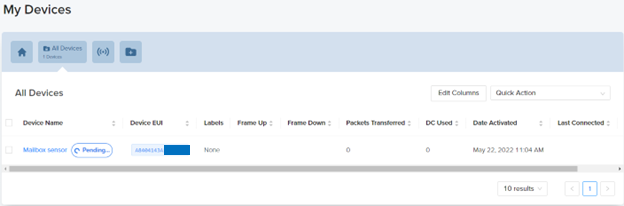
Example of Devices menu option when adding first sensor
You can view all transmission details for a device by clicking the device name from the device list, as shown below.
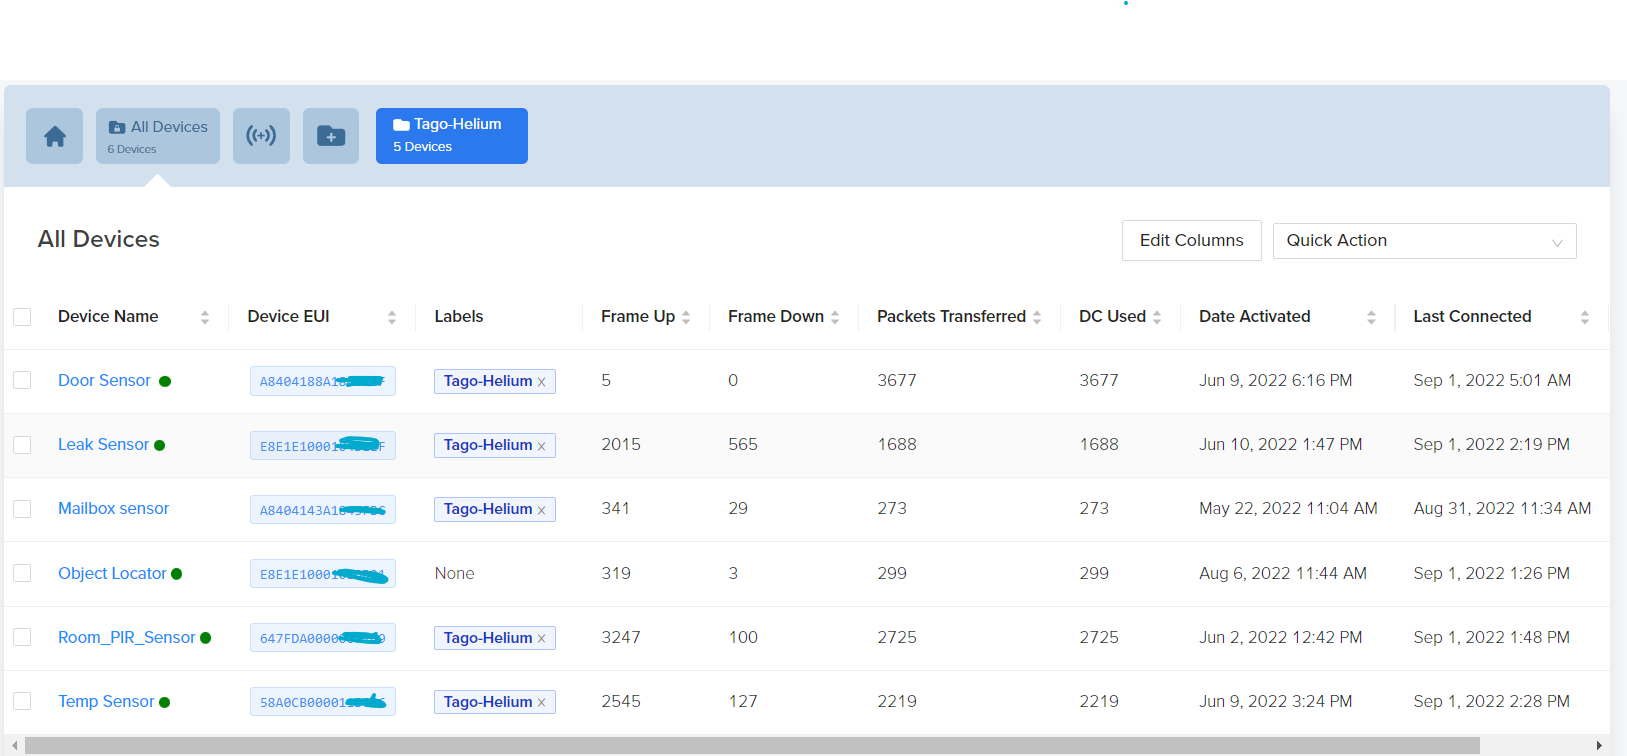
Example of device list
The next step is to activate the LoRaWAN device. In most cases, this means simply inserting batteries into the device or removing a plastic battery isolator tab or strip. Please refer to the specific instructions for your LoRaWAN device or sensor.
Important: Refer to Module 1 to ensure there is Helium Network coverage near the device before proceeding. If the device is not within range of a Helium Hotspot, you will not be able to observe any activity.
Once the LoRaWAN device is activated, it starts broadcasting LoRaWAN join request messages. All LoRaWAN networks in RF transmission range are always listening for these join messages. Only devices that have been registered with their specific DevEUI, JoinEUI (AppEUI), and AppKey will be allowed to join their specific LoRaWAN network. Since the mailbox sensor was added to Helium Console, it will only be able to join the Helium Network.
Monitor the detailed device dashboard to see the initial LoRaWAN join request message and join accept response exchange.
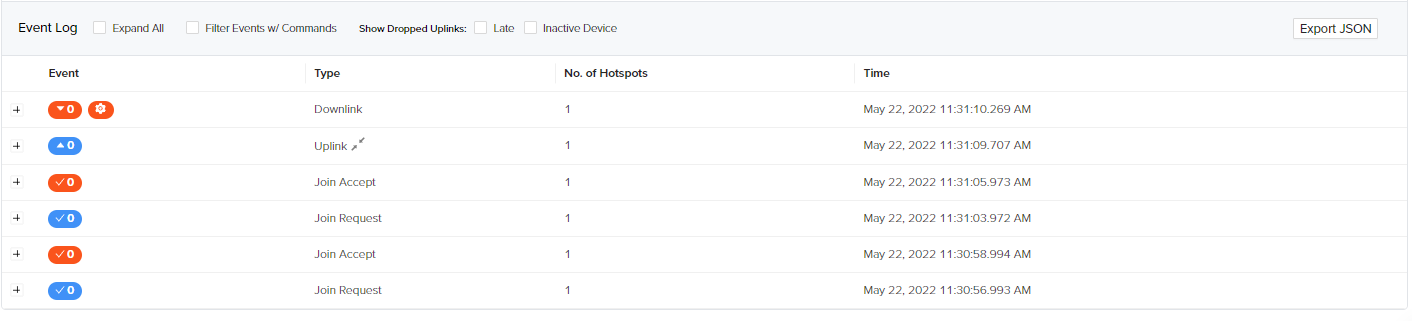
Initial Join Request and Accept message flow
You can see the details of the message exchange by clicking on any message event, including the LoRaWAN MAC commands and CF list/channel mask exchange.
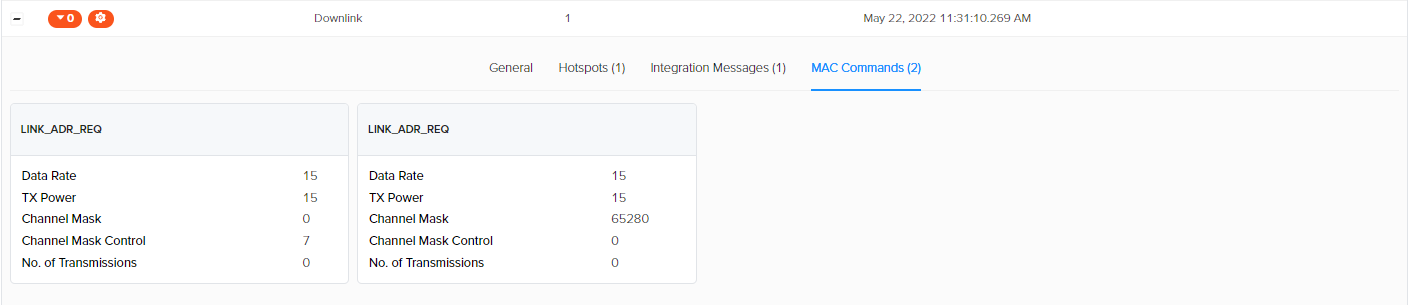
Details of a packet transmission
In addition, details of the ADR requests and acknowledgements are displayed. Note that not all LoRaWAN sensors support ADR or accept all ADR change requests, so if no ADR Acknowledgement is displayed, that does not necessarily indicate a problem. In most cases, Class A sensors will continue to operate properly even if they cannot adjust to ADR requests. Please refer to Understanding ADR for more details.
The specific Helium Hotspot that supported the device’s message transmission is also detailed, including the Received Signal Strength Indicator (RSSI) and signal-to-noise ratio (SNR). A detailed explanation of these RF parameters is beyond the scope of this series; however, normal LoRaWAN RSSI values range from below -130dB to over -30dB. The lower the value, the weaker the RF connection between the device and Hotspot.
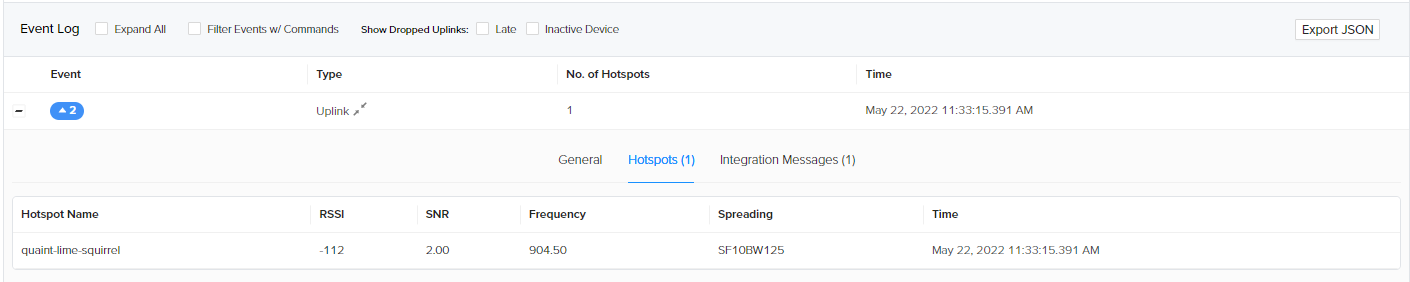
Example showing RSSI levels
After a device has successfully communicated with the Helium Network, clicking Coverage in the menu on the left will show all of the Hotspots that have exchanged messages with the device.
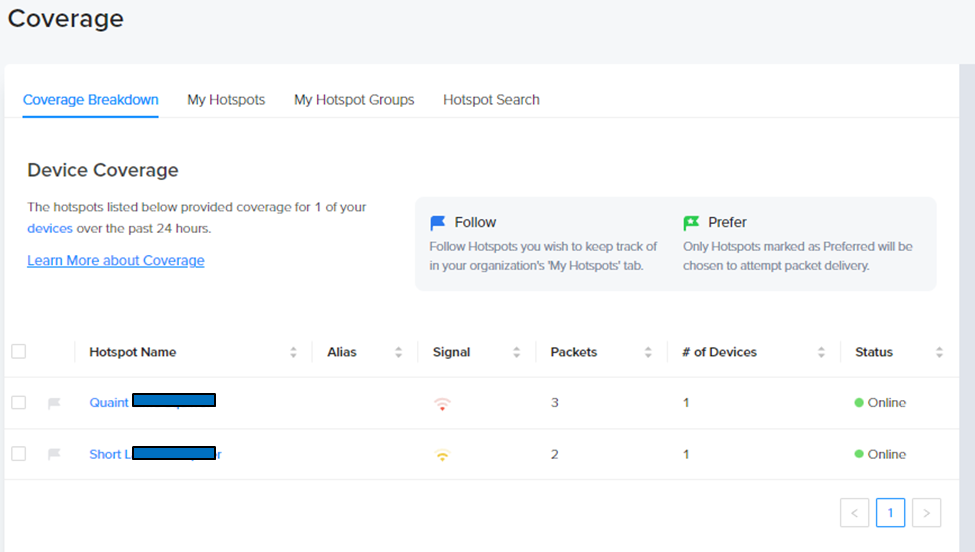
Example showing number of Helium Hotspots that have relayed packets from sensors
With all LoRaWAN networks, multiple gateways (Hotspots) in RF range of a message transmission from a device will all receive the same message and send it to the network server. This redundancy in RF coverage greatly enhances the reliability of all LoRaWAN-compatible networks, including Helium. The Helium Network and Helium Console provide a number of tools and utilities to allow you to fine-tune the network interaction of each device. These include selecting preferred Hotspot options and increasing message redundancy by adding packet configurations. Please refer to instructions within Helium Console to enable these features.
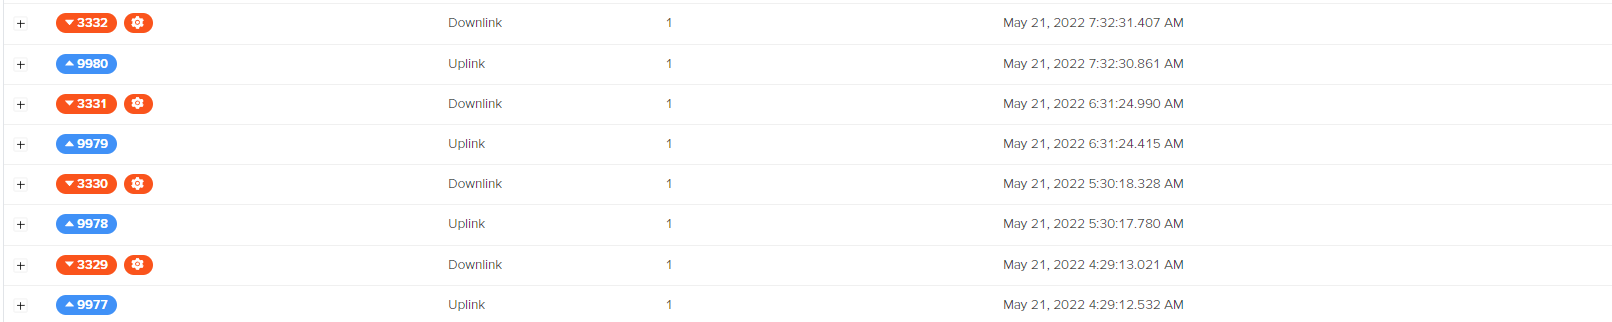
Continue to monitor the Event Log from the device’s detailed dashboard and observe received uplink messages shaded blue. In particular, verify that the Uplink Event count is incrementing properly (1, 2, 3, 4…).

Example of a LoRaWAN Join and transmit sequence
The device increments the uplink count by one for each message transmitted. Ideally, for a stationary device, every uplink message is received, and the blue uplink count is sequentially increased. All wireless networks have some message transmissions that are unsuccessful; this is referred to as packet loss. For some sensor applications, a certain amount of packet loss is acceptable; for example, receiving 98% of a temperature reading from a sensor may be sufficient. In order to optimize battery life and network capacity for these types of applications, LoRaWAN supports an unconfirmed uplink mode of Class A message transmission. In this mode, the device sends a message to the network and increments its uplink counter, but does not listen for a downlink acknowledgment confirming that the message was received. If you observe only incrementing blue uplink messages, then the sensor is operating in this mode. The Dragino door sensor is sending unconfirmed uplink messages as demonstrated above.
For other more mission-critical applications, confirmed Class-A message transmissions are used. In the case of a security door open/close sensor, every message must be delivered. If the first RF transmission fails, the device will keep resending the message until it is confirmed by receiving a downlink confirmation. For confirmed messages, the device dashboard displays an orange-shaded downlink message for every uplink message received. Like the uplink counter, the downlink message counter is incremented for each downlink transmission. Note that the actual values in the uplink and downlink series will likely diverge from each other over time. Inspect the event log for sequential uplink and downlink values to help ensure that a reliable network connection has been established and to help troubleshoot connection issues.
Example of a device sending confirmed uplink messages and the corresponding downlinks.
Troubleshooting checklist:
- If you do not see any message traffic for your device on the dashboard, verify the following:
- Make sure the device is in range of a Helium Hotspot and that the Hotspot is online (refer to Module 1 for network utilities).
- Check the real-time operational status of the Helium Network
- Double-check that the EUIs and keys are correct. Errors and typos when entering EUIs and keys are the number one reason devices fail to join.
- Verify that the device is powered and turned on.
- Verify that the device has not already been used on another LoRaWAN network. Refer to the device manufacturer’s manual on how to hard reset a device so it can join a new LoRaWAN network.
- Wait up to 24 hours and check again. Most LoRaWAN devices join within a few minutes. However, in order to optimize battery life, some devices may take up to 24 hours to join a LoRaWAN network. Refer to your device’s manual for details on Join behavior and Join retry times.
- If you see the Join Request message but the Join Accept fails, or you never see uplink messages:
- Double-check that the JoinEUI (AppEUI) and AppKey are correct, and make sure that the device has not been used on another LoRaWAN network.
- For US915 devices, make sure that the profile has been set up with the ADR/CF-List options enabled and that this profile has been applied to the device in the Console.
- If you only see a low percentage of uplink messages from the device:
- If you are only seeing a random subset of uplink messages from your device, it may be at the fringe of Helium Network coverage. If possible, move the device closer to a Helium Hotspot or near other Helium Hotspots. If you see an improvement in successful uplink transmissions, then poor RF coverage in the original deployment location is likely the root cause. Refer to Module 1 on options to deploy additional Helium Hotspots to enhance coverage in this area.
- If you have verified that RF coverage is not the issue and that only a subset of uplink messages are successful (for example, 12.5%, or 1 out of 8), then it’s possible that there is a LoRaWAN channel plan mismatch. Again, verify that the profile has been configured correctly and assigned to the device. After updating the profile in Helium Console, refer to the device manufacturer’s manual on how to hard reset a device so it can be forced to rejoin the network.
- In some cases, ADR may cause marginal connections. Update the profile and try disabling ADR.
For stationary device deployments, the sequences and RF data in the event log should be very predictable and stable. If you observe unreliable message transmission, then further troubleshooting or extending Helium Network coverage may be required. In the next module of this series, we will add additional sensors for a typical smart building monitoring system. In the final module of this series, we will explore a mobile asset tracker which has more variation in the event log data as it travels into and out of network coverage.