LoRa® on-premise - at Home and in the Office documentation
Create Dashboard
View the Device Dashboard
Note
You will need to wait a few hours, and probably a day or more, before you will see enough data to make sense of the measurements shown on the dashboard.
-
Click Applications in the menu on the left.
-
Click on the Door/Window Sensor Application.
-
The device registered to the application appears. Click on the link in the DevEUI field of the Door/Window device.
-
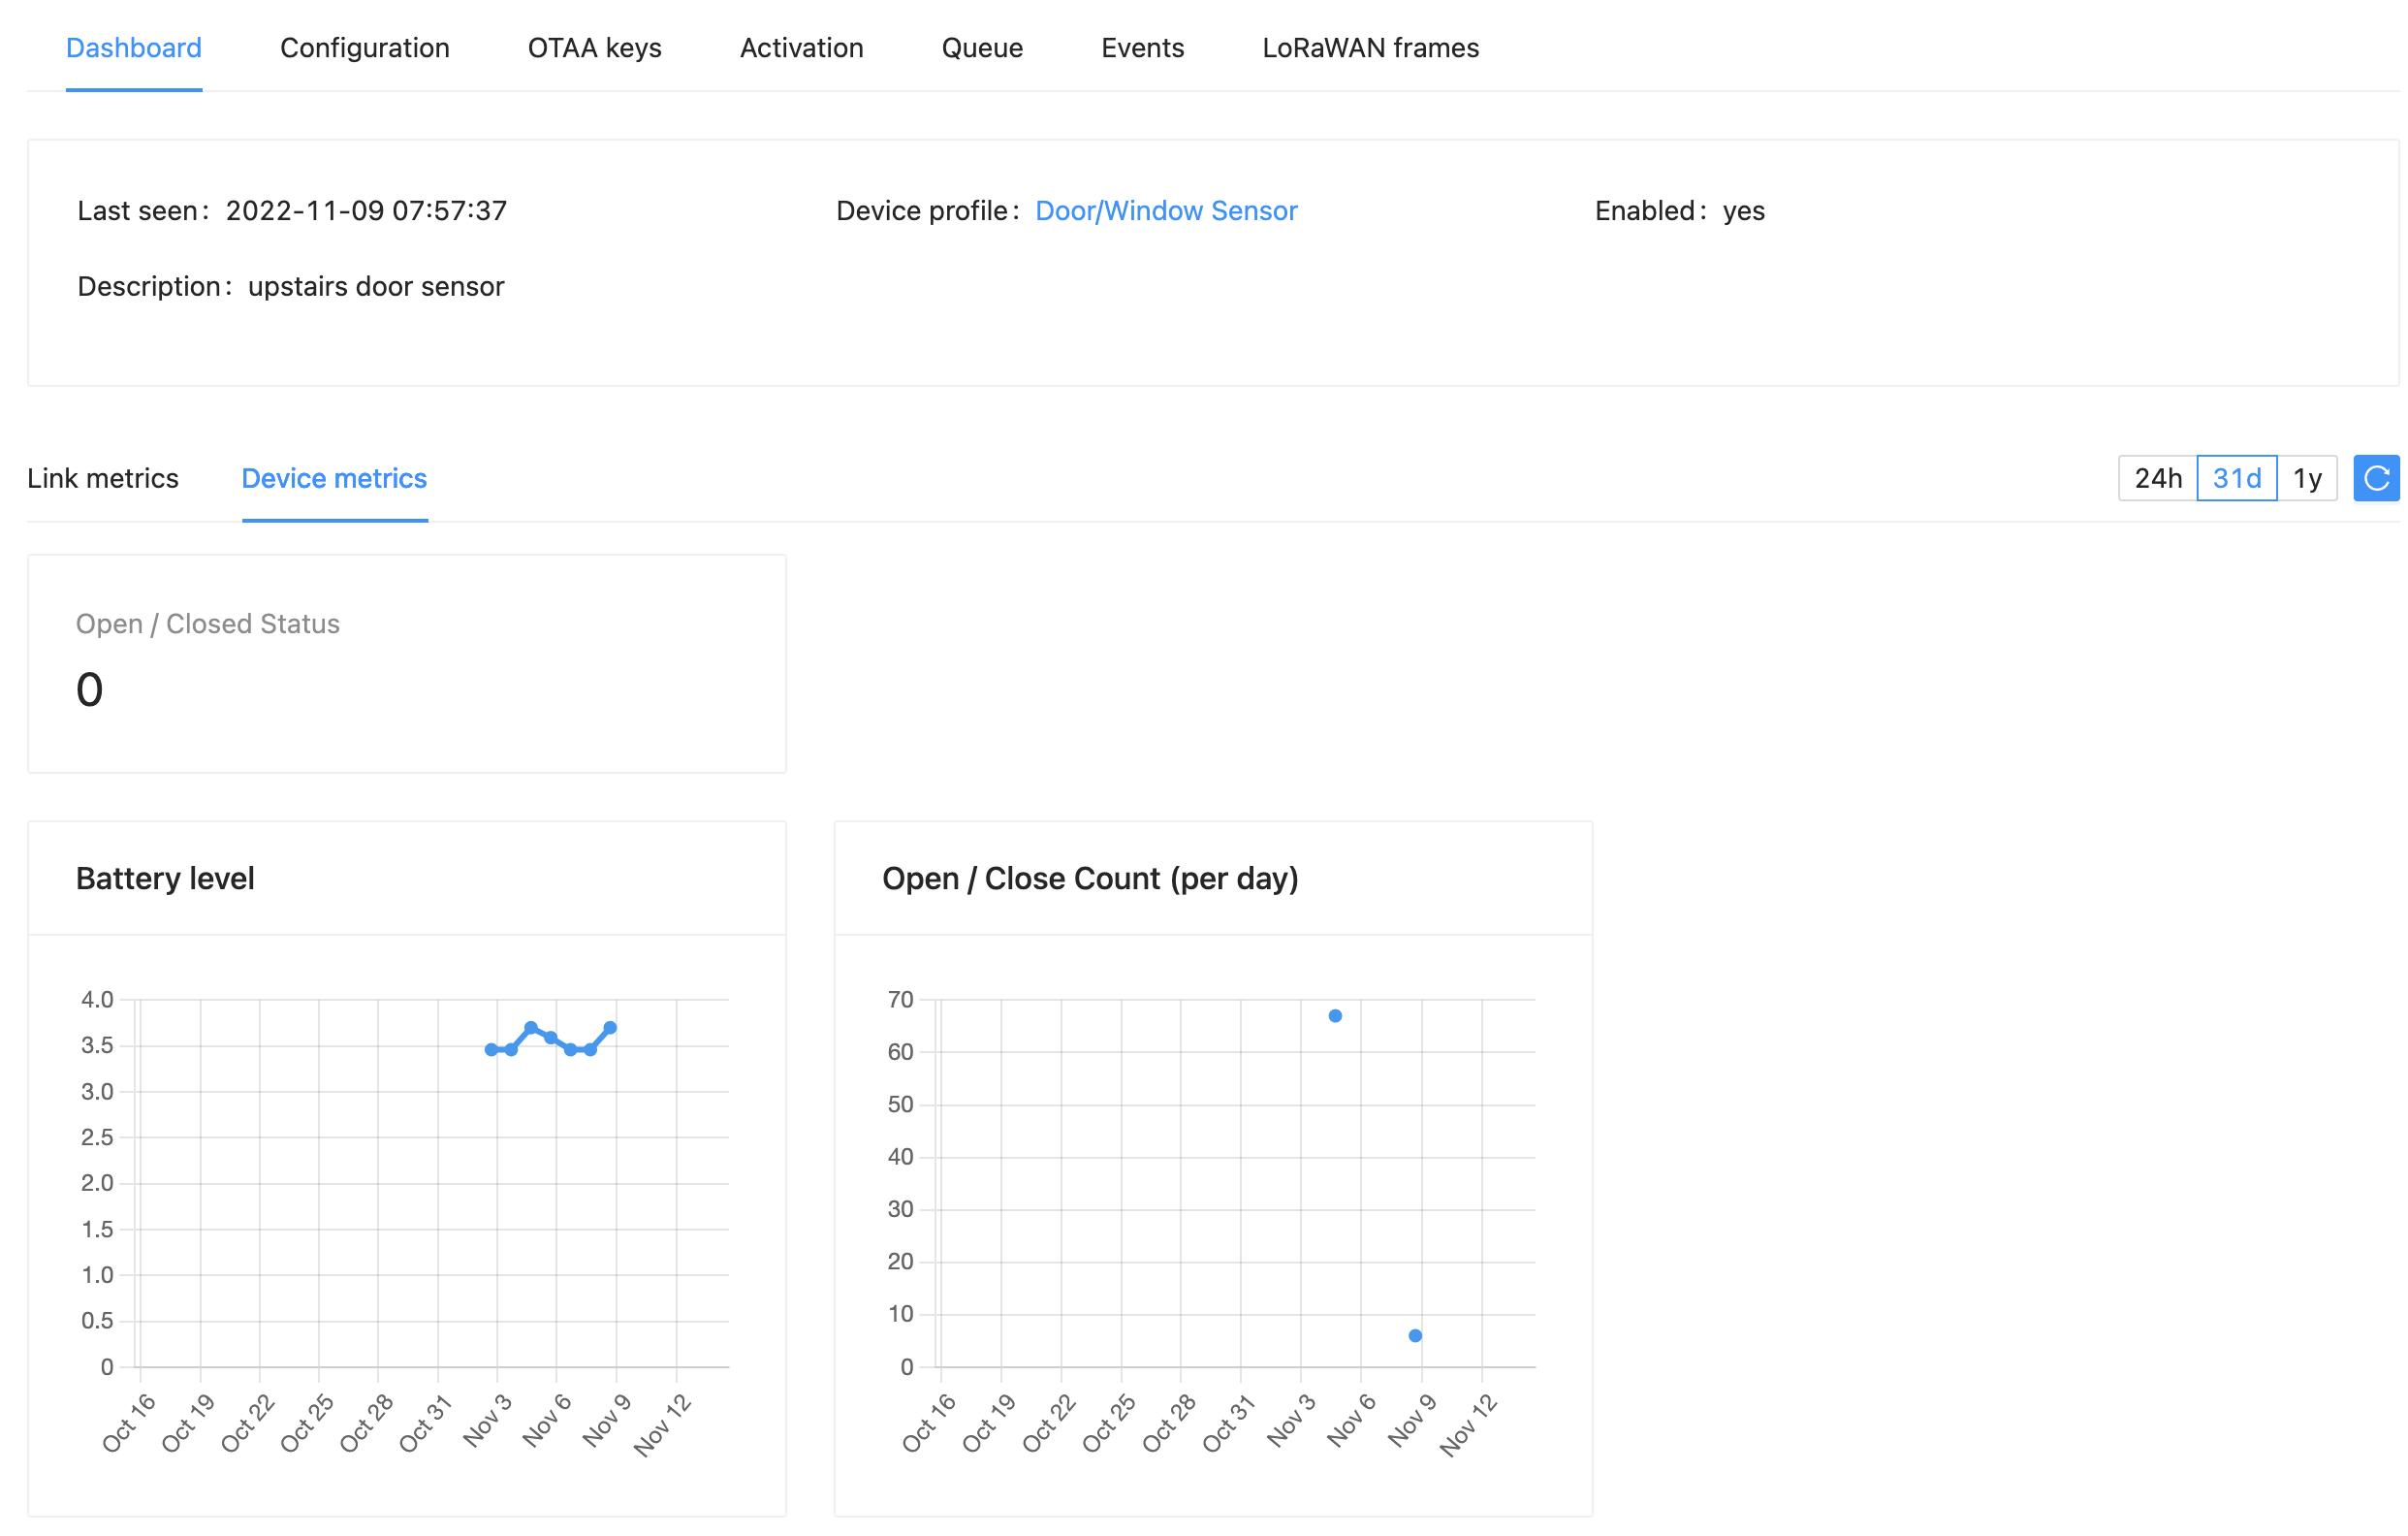
Click on the Device metrics tab inside of the open Dashboard tab.
-
A widget appears for each measurement you configured.

Figure 3: Device Dashboard Showing 31d View
-
Now view the dashboards for your other sensors in their applications by opening the relevant application and selecting each device.
You can now see device data directly in ChirpStack, summarized in an application dashboard. In the next section, you will turn the events coming from the device into something useful, like an email alert from IFTTT. You will do this using ChirpStack’s IFTTT integration with one of your applications.