LoRa® on-premise - at Home and in the Office documentation
Create Dashboard
Register Device Measurements
There are three types of measurements you want to show on the dashboard. These are Counter, Gauge and String. A fourth value type, Absolute, is for counters which get reset upon reading/uplink, and is not relevant here.
-
Counter is used for a numerical value which increments for the life of the device. Setting a measurement type to Counter will give you a graph showing the values over time.
-
Gauge is used for a numerical value between a maximum and minimum, such as the battery value. This will also appear on the dashboard as a graph of values changing over time.
-
String is used to display the value as-is on the dashboard. Use this if you don’t care about how the value changes over time, i.e., you don’t need a graph.
Keep these three types in mind as you define the measurements to display for each device.
Door and Window Sensor Measurements
-
Open the UI of your ChirpStack network server by browsing to
http://*CHIRPSTACK_IP_ADDRESS*:8080/if you haven’t already done so. -
Click Device profiles in the menu on the left and then click on the Door/Window Sensor device profile.
-
On the Device Profile page for the Door/Window Sensor, click on the Measurements tab.
-
Click on Add Measurement.
-
The Measurements page shows three columns, ordered left to right as follows:
-
Column 1, measurement key: A key matching one of the fields returned by the device codec, unique to each measurement.
-
Column 2, measurement kind: The type of graph you want to show, this defaults to unknown / unset, meaning it will not be shown.
-
Column 3, Measurement name: A descriptive label you must fill in so that the measurement will show up in the dashboard.
Before you set up your measurements, look at the payload for the door/window sensor in Figure 1.
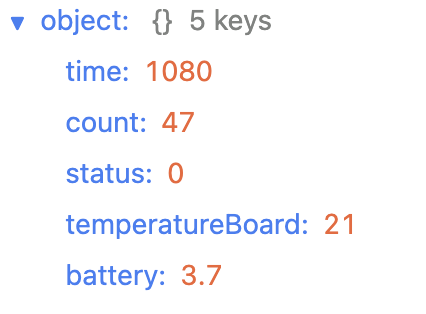
Figure 1: Door/Window Sensor payload values
You see the names of the fields found in the measurement key column, and the values that are output by the Codec in the Device Profile for this sensor. These field names and values are used in the next section to configure the dashboard.
Note
You can see the payloads yourself by clicking on Applications in the menu, choosing the Door/Window Sensor Application, clicking on the DEV_EUI for the Door device and selecting the Events tab. Click on an up event and browse to the object node in the Details screen.
You can view the payload Codec by clicking on Device Profiles in the menu, selecting the Codec tab and viewing the
decodeUplinkfunction in the Codec functions field. -
-
Locate the row where the value in column 1 is set to battery. Set the drop-down in the second column to Gauge and set the Measurement name to battery level.
Note
In this case, battery refers to the battery level of the device in volts.
-
Locate the row where the value in column 1 is set to count. Set the drop-down in the second column to Counter and set the Measurement name to Open/close count.
Note
In this case, count refers to the total number of times the door/window the sensor is attached to has been opened or closed.
-
Locate the row where the value in column 1 is set to status. Set the drop-down in the second column to String and set the Measurement name to Open/closed status.
Note
In this case, status is set to 0 if the door is closed, 1 if the door is open.
-
Leave remaining measurements set as Unknown / unset and do not give them labels. This means they will not show up in the dashboard.
-
Click the Submit button to save the measurements.
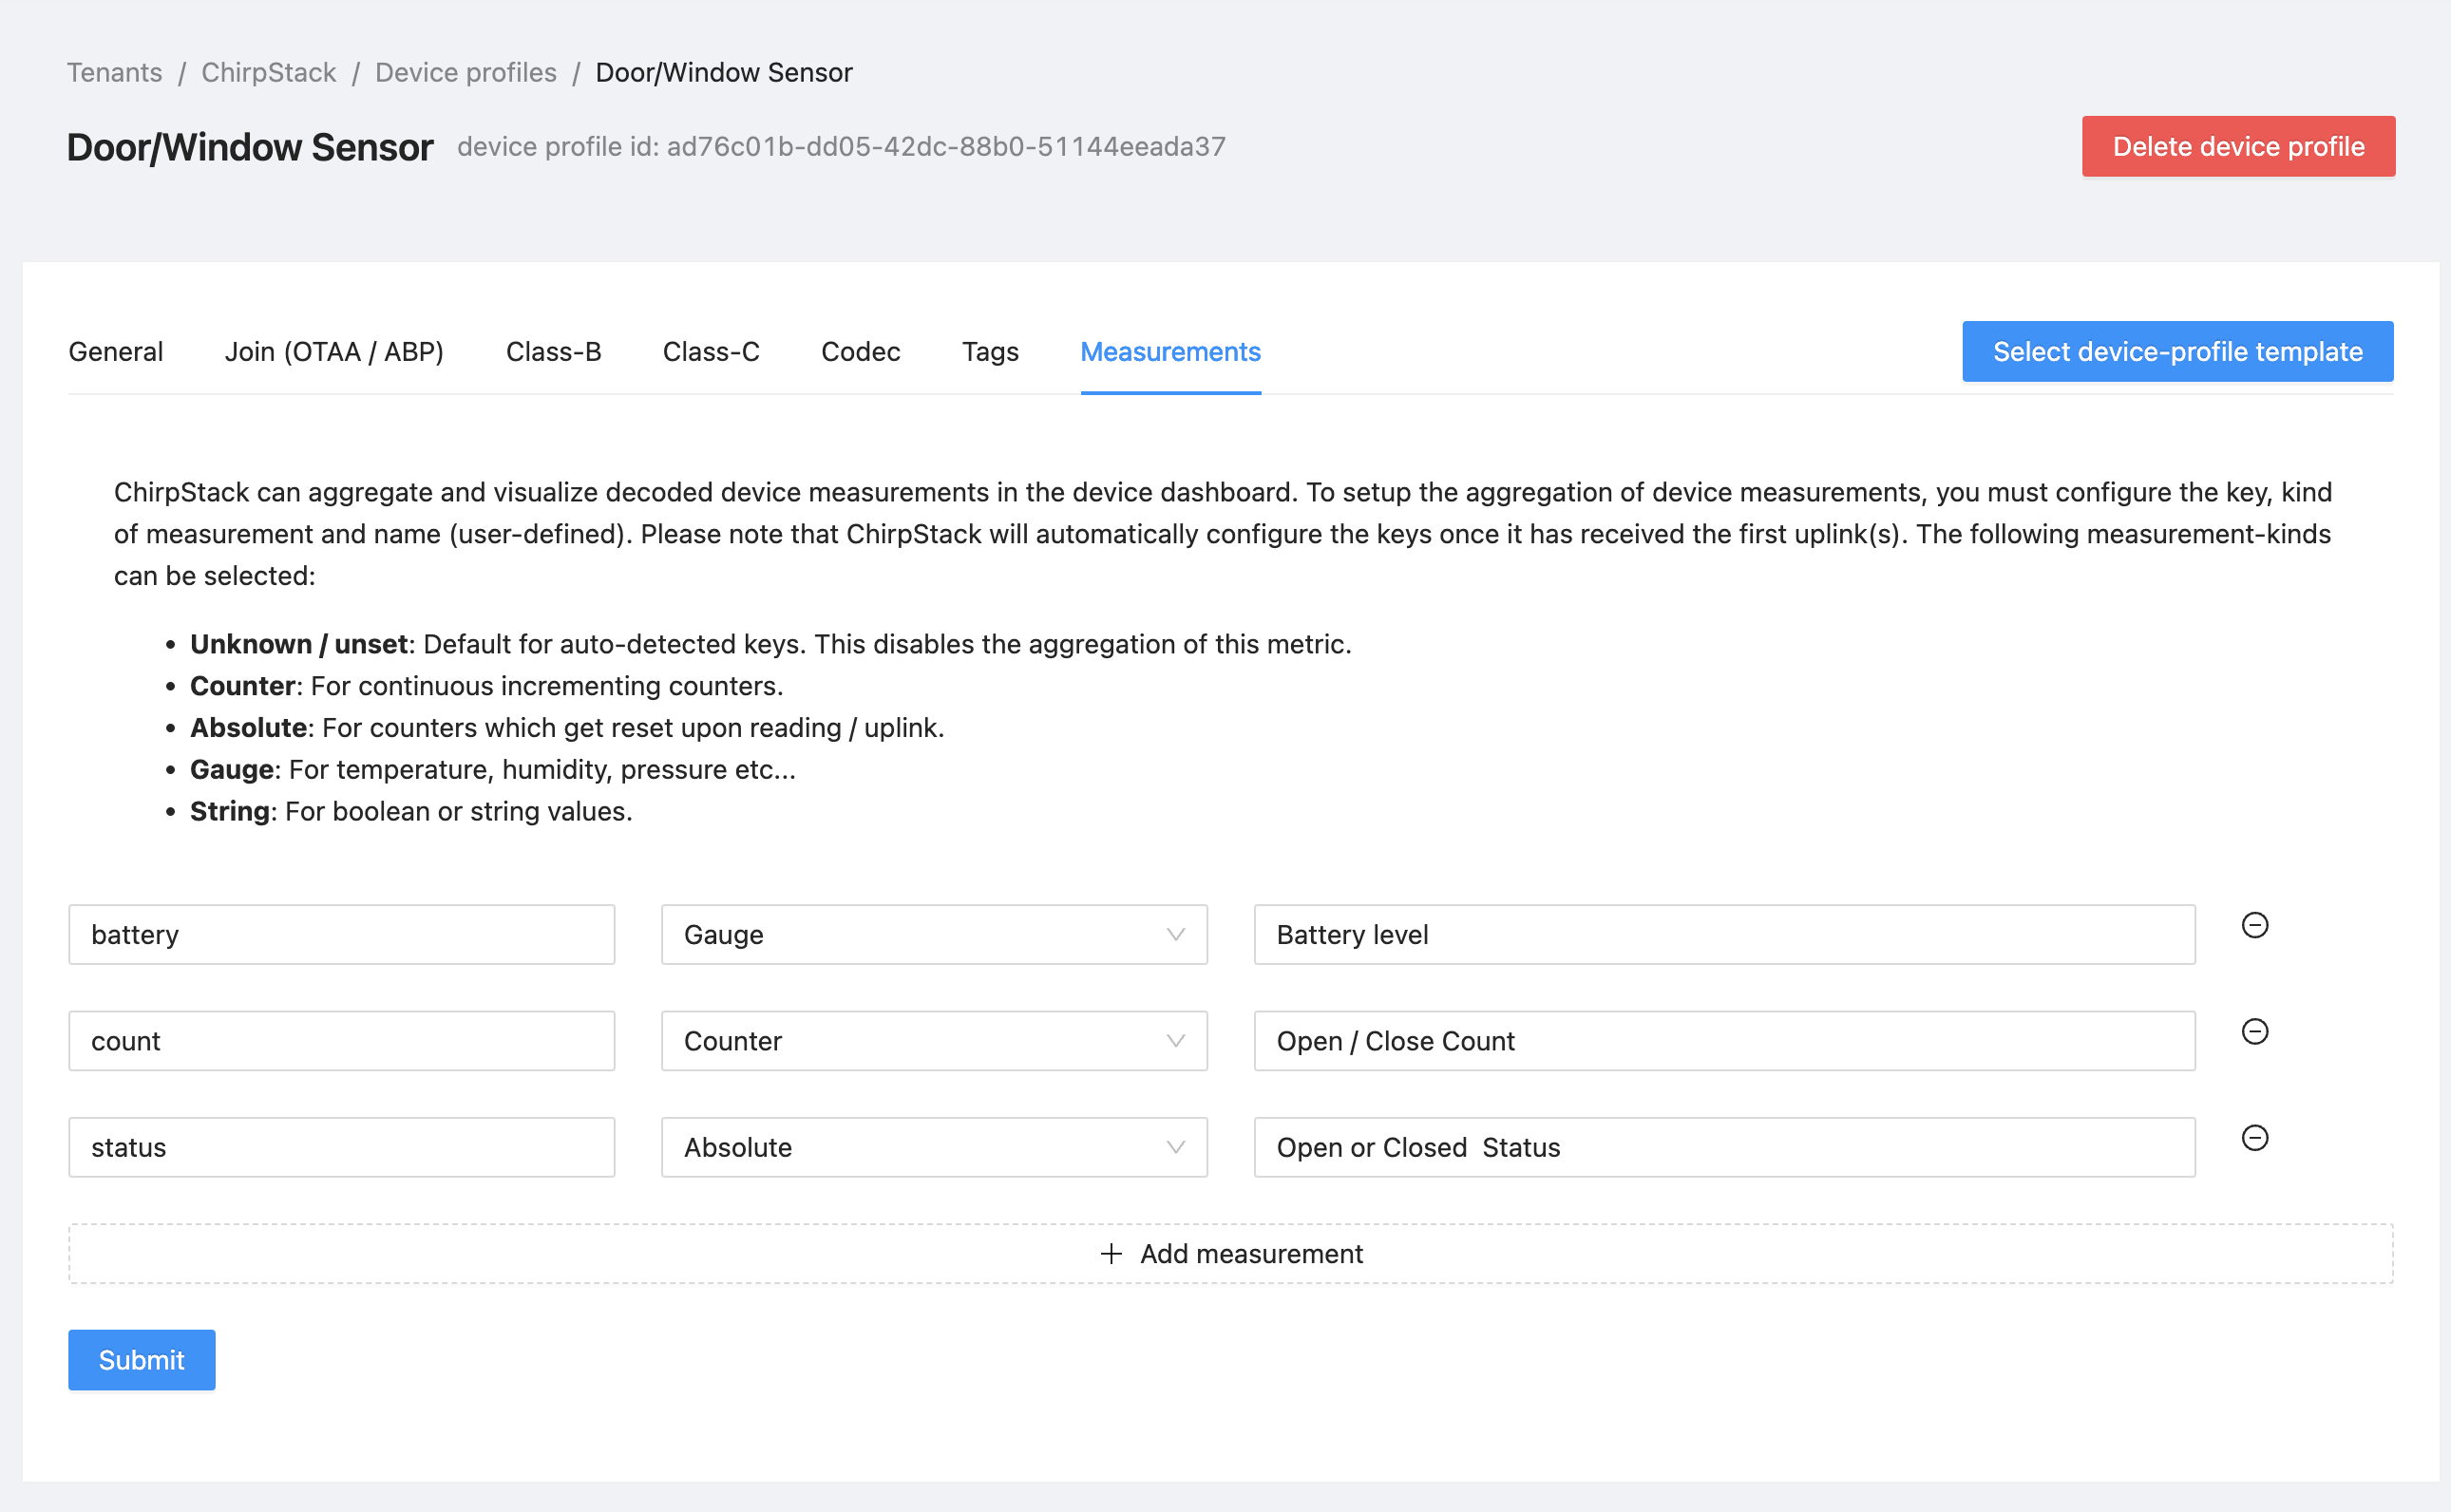
Figure 2: Door/Window Measurements
Motion Sensor Measurements
-
Open the UI of your ChirpStack network server by browsing to
http://*CHIRPSTACK_IP_ADDRESS*:8080/if you haven’t already done so. -
Click Device profiles in the menu on the left and then click on the Motion Sensor device profile.
-
On the Device Profile page, click on the Measurements tab.
-
Locate the row where the value in column 1 is set to battery. Set the drop-down in the second column to Gauge and set the Measurement name to battery level.
Note
In this case, battery refers to the battery level of the device in volts.
-
Locate the row where the value in column 1 is set to count. Set the drop-down in the second column to Counter and set the Measurement name to Motion detected count.
Note
Counter is used for a numerical value which increments for the life of the device. In this case, count refers to the total number of times motion has been detected.
-
Locate the row where the value in column 1 is set to status. Set the drop-down in the second column to String and set the Measurement name to Motion detected status.
Note
In this case, status is set to 0 when no motion has been detected for a period of time, 1 when motion has been detected. The graph will show detected movement over time.
-
Leave remaining measurements set as Unknown / unset and do not give them labels. This means they will not show up in the dashboard.
-
Click the Submit button to save the measurements.
Temperature/Humidity Measurements
-
Open the UI of your ChirpStack network server by browsing to
http://*CHIRPSTACK_IP_ADDRESS*:8080/if you haven’t already done so. -
Click Device profiles in the menu on the left and then click on the Temperature/Humidity Sensor device profile.
-
On the Device Profile page, click on the Measurements tab.
-
Locate the row where the value in column 1 is set to battery. Set the drop-down in the second column to Gauge and set the Measurement name to Battery level.
Note
A gauge is used for a numerical value representing the current setting between a maximum and minimum such as the battery value. In this case, battery refers to the battery level of the device in volts.
-
Locate the row where the value in column 1 is set to humidity. Set the drop-down in the second column to Gauge and set the Measurement name to Humidity.
Note
The humidity value represents the relative humidity percentage measured by the sensor.
-
Locate the row where the value in column 1 is set to temperature. Set the drop-down in the second column to Gauge and set the Measurement name to Temperature.
Note
The temperature value represents the temperature in degrees Celsius measured by the sensor.
-
Leave remaining measurements set as Unknown / unset and do not give them labels. This means they will not show up in the dashboard.
-
Click the Submit button to save the measurements.